High load, idle CPU: Spotlight was quietly eating my CI
A couple weeks ago I moved my CI onto my own Mac — the same GitHub Actions workflows, running on self-hosted runners, for about $0. It worked. Then it started getting slower. And flakier. Every day a little worse: emulator boots timing out, jobs cancelled mid-run, a stack of open PRs that seemed to deadlock the whole pipeline — every one red, nothing merging, the queue never draining.
The tell that this post exists at all was the proposed fix. My automated triage filed a P1 that read the symptoms confidently — "3 shared runners deadlock under a deep PR queue, resource saturation" — and offered three ways out: cap how many CI runs go at once, pin the heavy end-to-end tests to a single runner, or move them back to GitHub's paid cloud. Reasonable-sounding. Also: every one of them either slows CI down or costs money — the two things the whole self-hosted move was meant to avoid. When the cure undoes the reason you built the thing, that's your cue to doubt the diagnosis, not the machine.
It was never out of resources
Here's the first fact that didn't fit: the Mac has 64GB of RAM and I've never watched it drop below ~16GB free. "Out of memory" was never plausible. So I stopped trusting the story and looked at what the box actually reported while CI was choking:
load average: 66  95  122      # on a 10-core machine — ~10× oversubscribed
CPU usage: 72% idle             # …but the CPU is mostly doing nothing
swap used: 0.00 MB              # …and it isn't short on memory at all
Sit with those three together, because they only point one direction. A load average near 100 says a hundred things are waiting for their turn. But the CPU is 72% idle, so they aren't waiting for compute. And swap is flat zero, so they aren't waiting for memory. High load + idle CPU + zero swap means processes blocked on I/O. The queue wasn't for the cores. It was for the disk.
Which reframes the whole failure. The emulator-boot timeouts, the cancellations under load — those aren't a saturated machine. They're a saturated disk. So: what was hammering the disk?
The 25-gigabyte answer
The single largest process on the machine, bigger than anything I was actually
running, was mds_stores — Spotlight's index — sitting at 25.7GB resident.
ps -Ao rss,comm | grep -w mds_stores # 25.7 GBmacOS indexes your files so Spotlight search is instant. Useful on a laptop.
Quietly ruinous on a CI runner, because a runner's whole job is to churn
enormous numbers of files — every run does a fresh npm ci, builds artifacts,
boots emulators, and writes it all into the runner's _work/ directory. One of
mine held 2.8GB across ~85,000 files, times three runners, and none of them
were excluded from Spotlight. So every CI run generated tens of thousands of new
files, and Spotlight dutifully reindexed the lot — over and over, forever, the
index growing without bound. Nearly 2TB written to disk in a day and a half.
That's the "slower every day" mechanism I couldn't explain before. Nothing was leaking. The index just grows, and the reindex tax grows with it, until an emulator that needs the disk for 180 seconds can't get it.
The fix is one file per runner
You'd reach for mdutil -i off, and on a subdirectory it just errors
(invalid operation / unknown indexing state) — that switch only works on whole
volumes. The supported per-directory opt-out is a marker file:
for r in ~/actions-runner-*/; do
  touch "$r/_work/.metadata_never_index"
done
That's it. Spotlight stops indexing those trees immediately; the bloated index shrinks on its own as it revalidates. (Want it gone now instead of gradually? Drag the folders into System Settings → Spotlight → Search Privacy — the same exclusion, applied instantly.) Don't disable Spotlight globally — you only want the build trees out, not your whole machine going dark.
Free. Reversible. And it makes CI faster, not slower — it hands the disk back. The exact opposite of all three options in that P1.
Proof, not vibes
I split every metric at the minute I wrote those marker files and let CI run.
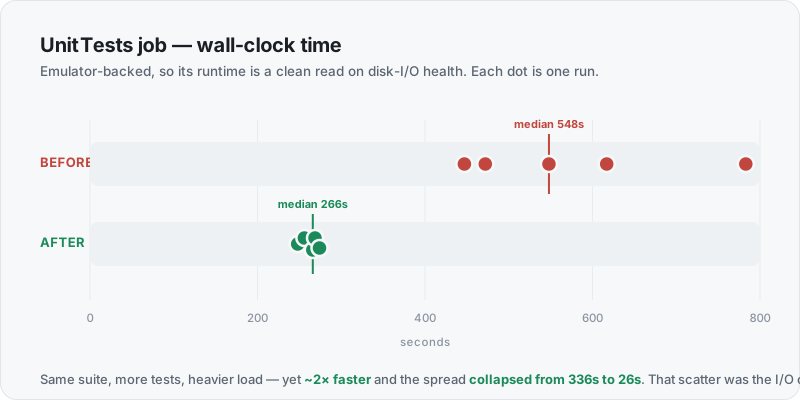
I leaned on the unit-test job to measure it, because it boots the Firestore and Auth emulators — so its wall-clock is a clean read on how healthy the disk is. Its median went from 548s to 266s, a ~2× speedup. But the number I trust most isn't the median — it's the spread. Before, runs scattered from 447 to 783 seconds; after, they cluster in a tight 248–274. That wide scatter beforehand is the I/O-contention fingerprint: when everything's fighting for one disk, timings smear. Remove the fight and they snap to a line. And this held up even though the "after" window was under heavier load and running more tests than before — so it isn't queue depth flattering the result. It's the disk tax lifting.
Alongside it, the Spotlight index fell from 25.7GB to 2.0GB, and the share of CI runs cancelled mid-flight — the saturation signature — dropped from 42% to 27%.
The honest part
I won't oversell it. Spotlight was the dominant cause, not the only one — a couple of unrelated flakes (a test timeout tuned too tight for a loaded runner, an end-to-end race) had their own separate fixes, and CI isn't a flawless green wall today. But the thing that was making my self-hosted CI degrade a little more every single day is gone, for the price of three empty files.
Two lessons I'm keeping. The small one: on any long-lived Mac that churns files — a CI runner, a build box — exclude the work directories from Spotlight on day one. The bigger one: when a proposed fix would quietly undo the reason you built the thing, re-check the diagnosis before you pay for it. The machine was telling the truth the whole time. Load was high, the CPU was bored, and nothing was swapping. It was never out of resources — it was just waiting on a disk that was busy indexing its own homework.